In order to prevent non-conforming products from being shipped, 100% inspection is a common practice. Every product produced is inspected and judged as qualified or unqualified. Qualified products will be shipped, and unqualified products will be left for repair or scrap.
All this is simple and straightforward. Regardless of the errors of the inspectors, it seems that 100% inspection is a very effective method.
The purpose of this article is to use mathematics to prove why a 100% screening check is not 100% effective.
We assume that the characteristic value of the product is normally distributed, denoted by Y, as shown in the figure below.
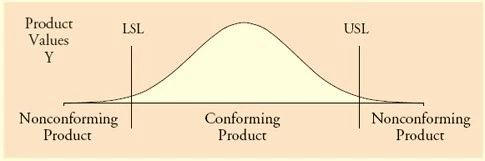
The qualification standard of the product is known, and the specification values of the upper and lower limits have also been given, such as LSL and USL in the above figure. Products between LSL and USL will be qualified products.
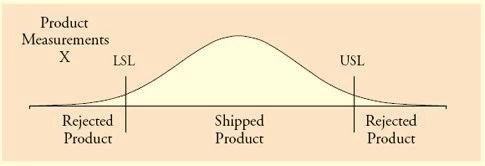
But we don’t know the actual value of Y, we need to use a measuring system to measure it, and the measured value of Y is called X.
The measured value of X is not equal to Y, because there is a measurement error, we call this error E. Because the measurement error is also normally distributed, we get the distribution of the measurement value as shown in the figure below, which is similar to the distribution shape of Y, but the variance of X is larger, which is equal to the variance of Y plus the variance of measurement error E.
Next, we use the bivariate normal distribution to show the correlation between Y and X.
The probability model of the distribution can be represented by a series of ellipses in the XY coordinate plane. The figure below shows the one, two and three standard deviation contours of two bivariate normal distributions, where the correlation coefficients within the group are set to 0.95 and 0.80.
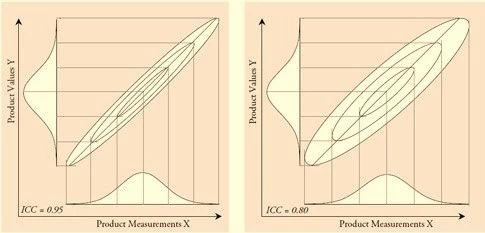
As can be seen from the above figure, as the measurement error increases, the ellipse of the bivariate normal distribution becomes fatter and the main axis is skewed.
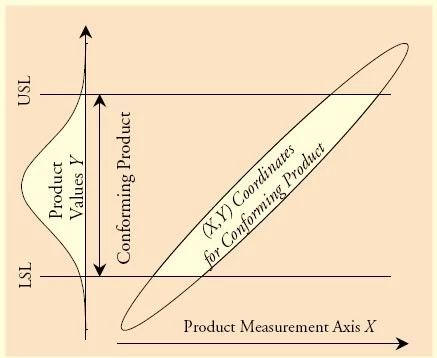
What we are interested in is: Which range of measurement value X corresponds to qualified Y.
The white range in the figure below indicates the range of qualified products.
The following icon shows the range of products shipped after 100% inspection.
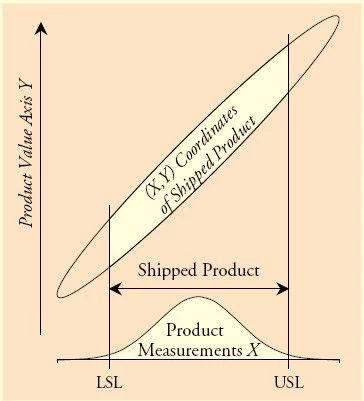
So far, we have clearly seen that the scope of products shipped after 100% inspection is different from the scope of actual qualified products.
The range of products that passed 100% inspection ≠ the range of qualified products
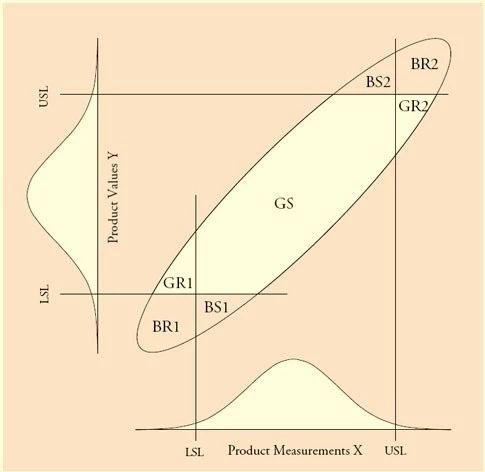
We divide all products into four categories based on the quality of the products and whether they are shipped or not:
Qualified products passed the inspection (GS: Good and Shipped)
Products rejected by qualified inspection (GR: Good and Rejected)
Unqualified products passed the inspection (BS: Bad and Shipped)
Products rejected by unqualified inspection (BR: Bad and Rejected)
GS and BR are the results we want to see, BS will cause trouble to customers, and GR will bring trouble to ourselves.
The figure below shows the position of each category in the bivariate normal distribution.
For the producer, what he hopes is that the proportion of qualified products shipped (PGS: Proportion of good product that is shipped) as high as possible:
PGS = GS / (GS + GR1 + GR2)
For the customer, what he hopes is that the PBR: Proportion of bad product that is rejected (PBR: Proportion of bad product that is rejected) is as high as possible:
PBR = (BR1 + BR2) / (BR1 + BR2 + BS1 + BS2)
Unfortunately, PGS and PBR are not linearly related.
The following is an evaluation table showing the values of PGS and PBR under different measurement error levels and the proportion of overall non-conforming products.
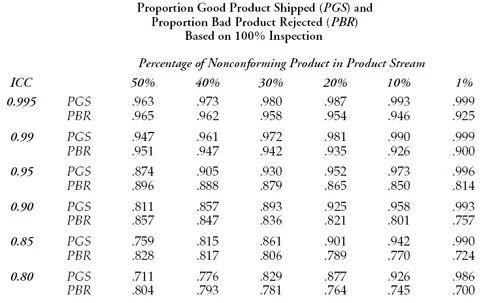
Interpretation of the data in the bottom right corner of the above table: When the overall product failure rate is 1% and the measurement error is large (ICC = 0.8), the producer will have a 98.6% probability of shipping qualified products. , But the rejection rate of defective products is only 70%, and a large number of defective products will flow to customers.
How to solve this problem? There seems to be only two ways.
The first method: adhere to the 100% test, then the measurement system must be improved to make the ellipse in the bivariate normal distribution as flat as a straight line. At this time, both PGS and PBR will be very high.
The price is: you need a measurement system that is close to perfect, which often requires huge investment, and the huge investment does not solve the problem, but only keeps the problem.
The second method is to improve the process capability so that the output of the process is within the upper and lower limits of the specification. At this time, 100% inspection is no longer necessary, which can save the investment in upgrading the test system, and save the cost of inspection. The key is to really solve the problem.
So far, our conclusion has been very clear:
The existence of measurement system errors makes 100% inspection unable to be 100% effective;
100% inspection cannot solve the quality problem, and unnecessary equipment investment and personnel inspection costs will be required;
The measurement system should be used to substantially improve the quality and consistency of the production process, not for inspection.
Any PCB need production please Contact us freely! RunTek PCBs Factory email:[email protected]